Capacity Filled Projects Overview
Intended Use Case
The goal of this report is to provide an overview of how many seats have been offered historically for a given slice of courses (1stLevel Humanities courses in the Fall, Theology Ethics, LCAS Undergraduate Summer Courses, etc) compared to the number of seats for a given year.
Given the average number of seats filled relative to population of either the university as a whole or the incoming freshman class for the respective academic year, we can also use this number to provide a projection on the number of seats we are likely to fill in the upcoming year (again, based on estimated size of the incoming class or total population)
Overview of Basic Usage
Usage is fairly simple. The user provides the parameters to decide on the slice of courses they are interested in view. Then they simply need to read the resulting chart.
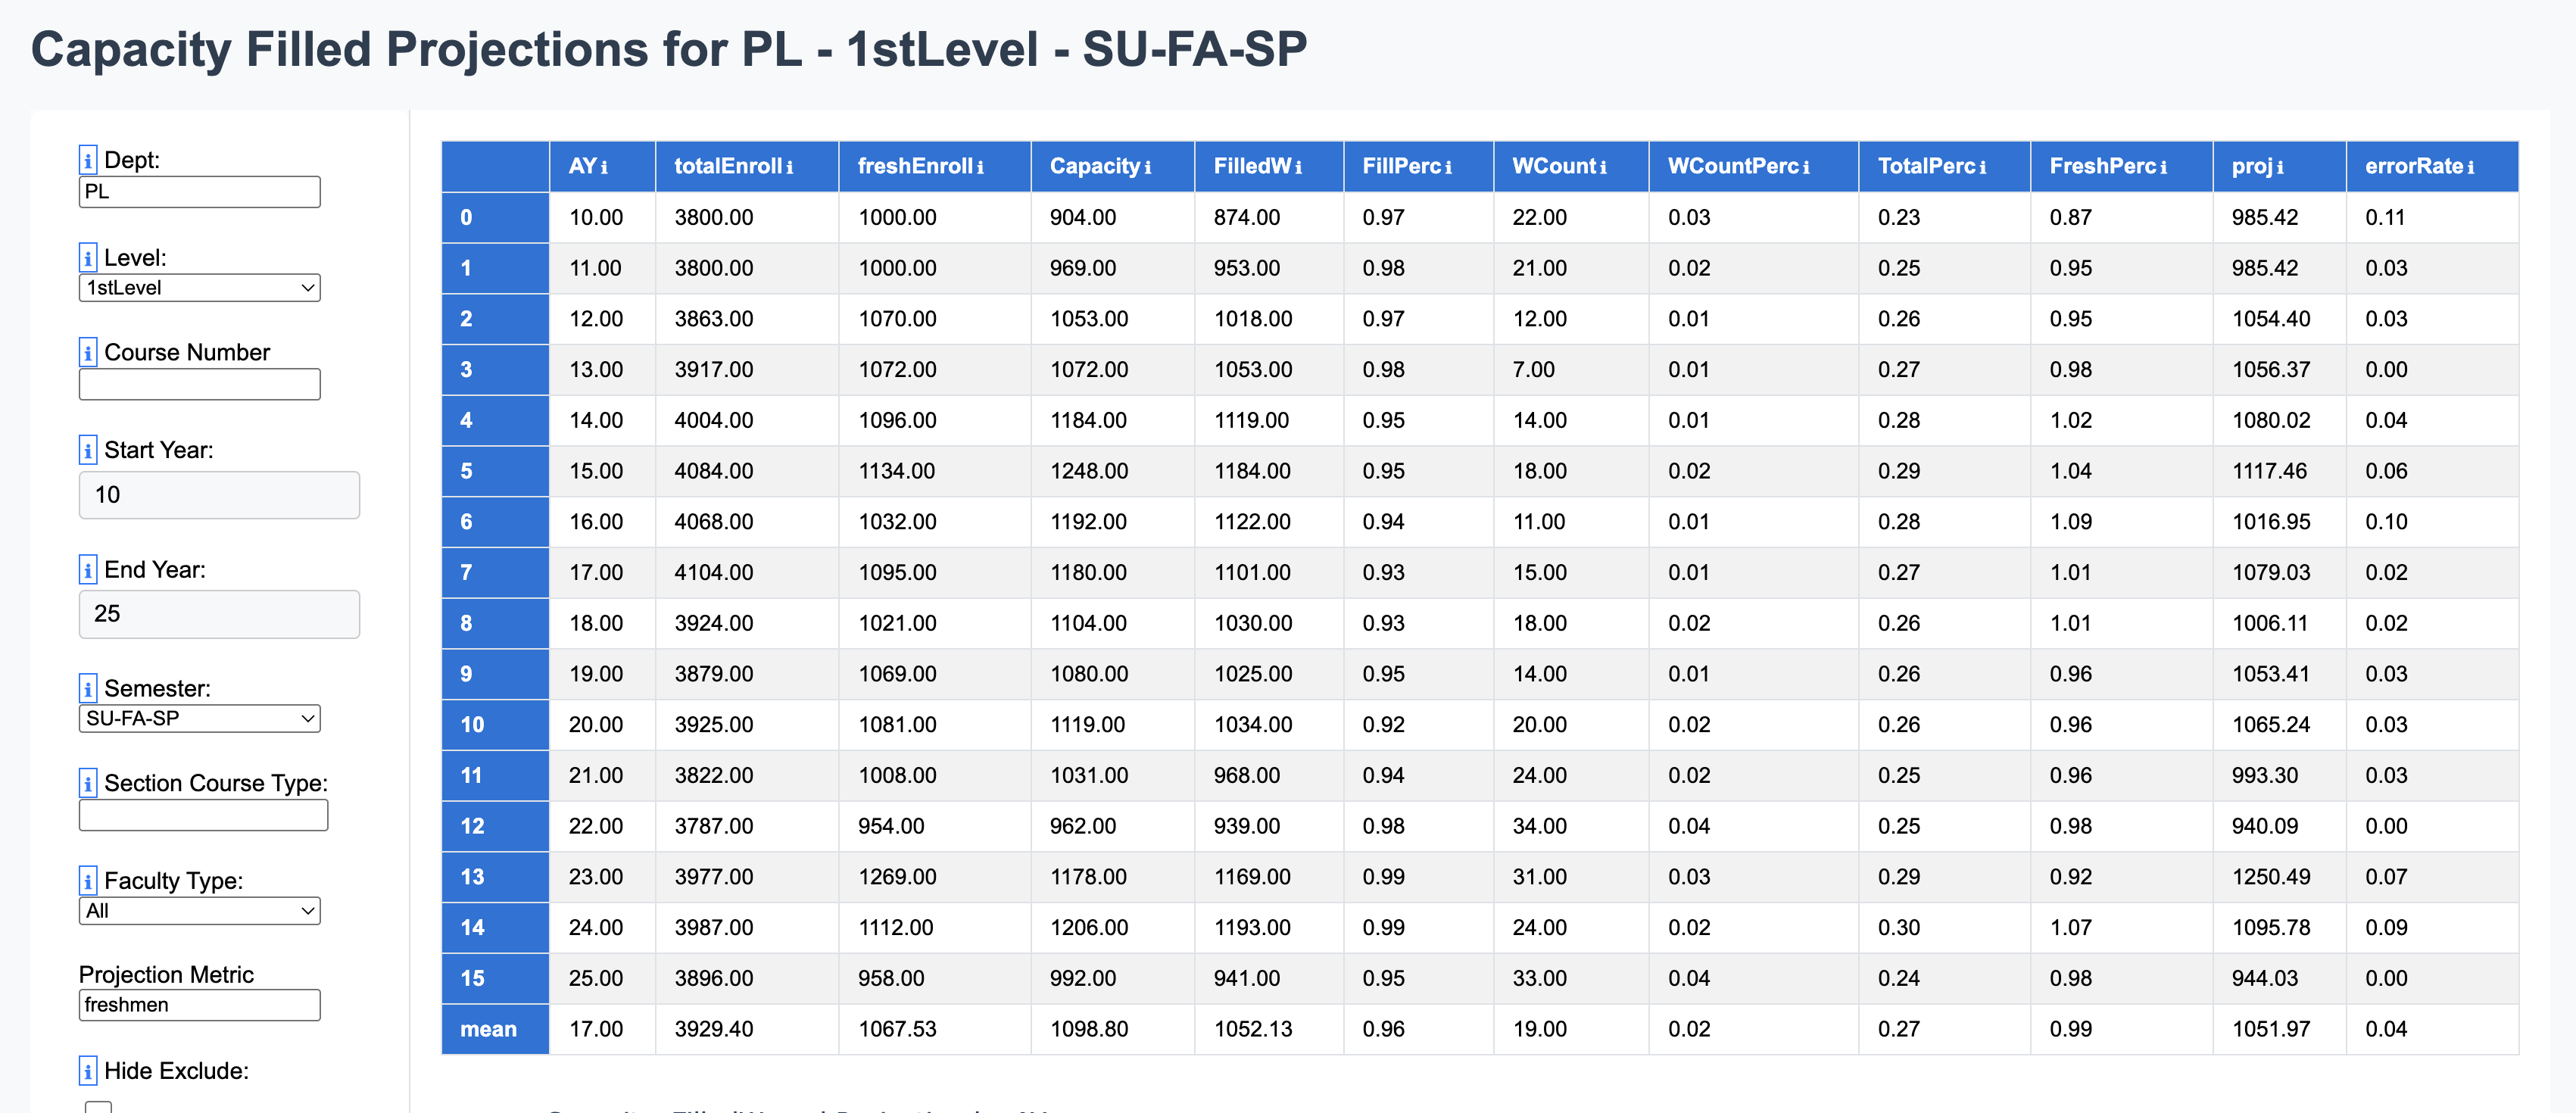
Here is the historical chart for PL 201 courses from 2010-2025.
totalEnroll and freshEnroll indicate the number of students for that academic year (AY 25 means academic year 2024-2025)
Capacity is the number of seats offered in that category.
FilledW is the number of seats filled including student who eventually withdrew from the course.
FillPerc tell us us the fill rate for this courses.
TotalPerc tell us what percentage the number of filled seats is of the entire student population in that year.
FreshmenPerc tell us what the number of filled seats is of the size of the incoming freshman class.
Based on either the mean TotalPerc percentage or the FreshPerc for the selected time span, this percentage is then multiplied by the population size respective to the metric used (Total Size or Freshman Size), the result is the project of how many we anticipate being filled in that AY.
The error rate represents how far off the projection is from the actual number of seats filed.
We can see that using this mean percentage, the error is historically very low and should give us a confidence to use this project number to estimate the future number of needed seats.